2QFY2016 Result Update | Automobile
October 28, 2015
Maruti Suzuki
ACCUMULATE
CMP
`4,496
Performance Highlights
Target Price
`4,960
Y/E March (` cr)
2QFY16 2QFY15
% chg (yoy)
1QFY16
% chg (qoq)
Investment Period
12 Months
Net Sales
13,934
12,315
13.1
13,425
3.8
Stock Info
EBITDA
2,269
1,532
48.1
2,189
3.7
Sector
Automobile
EBITDA Margin (%)
16.3
12.4
390 bp
16.3
-
Market Cap (`
cr)
135,802
Adj. PAT
1,226
863
42.1
1,193
2.7
Net Debt (` cr)
(12,652)
Source: Company, Angel Research
Beta
0.8
Results in line with estimates: Maruti Suzuki India Ltd (MSIL)’s 2QFY2016 results
52 Week High / Low
4,763/3,130
have come in in line with our estimates. Its revenues grew 13% yoy to `13,934cr,
Avg. Daily Volume
92,716
in line with our expectations of `14,007cr. Volumes grew 10% yoy while the
Face Value (`)
5
realization/vehicle grew 3% yoy on account of a better product mix. MSIL
BSE Sensex
27,040
maintained its record high margins similar to 1QFY2016; margins rose sharply
Nifty
8,171
by 390bp yoy to 16.3%, and are in line with our estimate. A favorable currency
Reuters Code
MRTI.BO
movement (depreciation of Japanese Yen and Euro vis-a-vis the Indian Rupee) led
Bloomberg Code
MSIL@IN
to lower imported raw material costs. This, coupled with decline in discounts,
boosted the operating margin. On the back of the robust operating performance,
the net profit came in at `1,226cr, in line with our estimate of `1,248cr.
Shareholding Pattern (%)
Promoters
56.2
Outlook and valuation: The passenger vehicle (PV) industry is well poised to post
MF / Banks / Indian Fls
18.9
double-digit growth over the next two years, given the improved consumer
FII / NRIs / OCBs
22.2
sentiments, better economic outlook, and softer fuel prices. Further, new launches
by MSIL, with it having recently introduced the premium hatch - Baleno and a new
Indian Public / Others
2.7
compact SUV, would enable it to gain market share, going ahead. Also, we
believe MSIL would be able to sustain higher margins (we have built in ~17%
Abs. (%)
3m 1yr
3yr
margin levels in our estimates for FY2016/17) given the subdued commodity
Sensex
(1.5)
0.6
45.2
prices and favorable currency rates. Reduction in discounts due to improved
Maruti Suzuki
7.1
42.7
228.9
industry outlook coupled with new product launches and benefits of operating
leverage would also enable MSIL to sustain margins at elevated levels. We view
MSIL as the best play on passenger vehicle demand recovery and expect 36%
3-year price chart
earnings CAGR over FY2015-2017. We have retained our earnings estimates
5,000
given the inline results and maintain our Accumulate rating on the stock with a
4,000
price target of `4,960 (based on a PE multiple of 22x FY2017 EPS).
3,000
Key financials (post SPIL merger)
2,000
Y/E March (` cr)
FY2014
FY2015
FY2016E
FY2017E
Net Sales
43,701
49,971
57,865
68,104
1,000
% chg
1.4
14.3
15.8
17.7
0
Net Profit
2,783
3,711
5,324
6,810
% chg
21.0
33.4
43.5
27.9
EBITDA (%)
11.6
13.4
16.4
16.7
Source: Company, Angel Research
EPS (`)
92.1
122.9
176.3
225.5
P/E (x)
48.8
36.6
25.5
19.9
P/BV (x)
6.5
5.7
5.0
3.4
RoE (%)
13.3
15.7
19.4
21.2
RoCE (%)
16.2
20.5
26.3
28.4
Bharat Gianani
EV/Sales (x)
2.9
2.7
2.2
1.8
022-3935 7800 Ext: 6817
EV/EBITDA (x)
25.1
19.8
13.1
10.6
Source: Company, Angel Research
Please refer to important disclosures at the end of this report
1
Maruti Suzuki | 2QFY2016 Result Update
Exhibit 1: Quarterly financial performance
Y/E March (` cr)
2QFY16
2QFY15
% chg (yoy)
1QFY16
% chg (qoq)
1HFY16
1HFY15
% chg (yoy)
Net Sales
13,934
12,315
13.1
13,425
3.8
27,359
23,743
15.2
Raw-material cost
9,312
8,775
6.1
9,045
3.0
18,357
16,959
8.2
(% of Sales)
66.8
71.3
67.4
67.1
71.4
Staff cost
418
370
13.0
463
(9.7)
881
723
21.8
(% of Sales)
3.0
3.0
3.4
3.2
3.0
Other Expenses
1,934
1,638
18.0
1,728
11.9
3,662
3,142
16.5
(% of Sales)
13.9
13.3
12.9
13.4
13.2
Total Expenditure
11,664
10,783
8.2
11,236
3.8
22,900
20,824
10.0
Operating Profit
2,269
1,532
48.1
2,189
3.7
4,458
2,919
52.8
OPM (%)
16.3
12.4
16.3
16.3
12.3
Interest
18
35
(48.9)
19
(6.6)
37
73
(49.8)
Depreciation
669
599
11.8
672
(0.3)
1,341
1,182
13.4
Other Income
137
182
(24.6)
172
(20.3)
309
420
(26.4)
PBT (excl. Extr. Items)
1,719
1,080
59.1
1,671
2.9
3,390
2,083
62.7
Extr. Income/(Expense)
PBT (incl. Extr. Items)
1,719
1,080
59.1
1,671
2.9
3,390
2,083
62.7
(% of Sales)
12.3
8.8
12.4
12.4
8.8
Provision for Taxation
494
218
126.6
478
3.4
971
458
112.0
(% of PBT)
28.7
20.2
28.6
28.7
22.0
Reported PAT
1,226
863
42.1
1,193
2.7
2,418
1,625
48.8
Adj PAT
1,226
863
42.1
1,193
2.7
2,418
1,625
48.8
Adj. PATM
8.8
7.0
8.9
8.8
6.8
Equity capital (cr)
151.0
151.0
151.0
151.0
151.0
Reported EPS (`)
40.6
28.6
42.1
39.5
2.7
80
54
48.8
Source: Company, Angel Research
Exhibit 2: 2QFY2016 - Actual vs Angel estimates
Y/E March (` cr)
Actual
Estimates
Variation (%)
Net Sales
13,934
14,007
(0.5)
EBITDA
2,269
2,265
0.2
EBITDA margin (%)
16.3
16.2
10 bp
Adj. PAT
1,226
1,248
(1.8)
Source: Company, Angel Research
October 28, 2015
2
Maruti Suzuki | 2QFY2016 Result Update
Exhibit 3: Quarterly volume performance
Volume (units)
2QFY16 2QFY15
% chg (yoy) 1QFY15
% chg (qoq) 1HFY16 1HFY15
% chg (yoy)
A: Mini: M800, Alto, WagonR
110,987
98,992
12.1
104,801
5.9
215,788
201,721
7.0
A: Compact: Swift, Ritz, Celerio,Dzire
144,439
136,402
5.9
137,833
4.8
282,272
259,699
8.7
A: Mid-Size: Ciaz
10,546
1,658
536.1
13,374
(21.1)
23,920
2,177
998.8
Total Passenger cars
265,972
237,052
12.2
256,008
3.9
521,980
463,597
12.6
B: Utility Vehicles: Gypsy, Grand Vitara
21,083
17,102
23.3
15,550
35.6
36,633
32,369
13.2
C: Vans: Omni, Eeco
36,214
33,533
8.0
34,136
6.1
70,350
62,364
12.8
Total Domestic
323,269
287,687
12.4
305,694
5.7
628,963
558,330
12.7
Total Exports
30,066
34,211
(12.1)
35,635
(15.6)
65,701
63,462
3.5
Total Volume
353,335
321,898
9.8
341,329
3.5
694,664
621,792
11.7
Source: Company, Angel Research
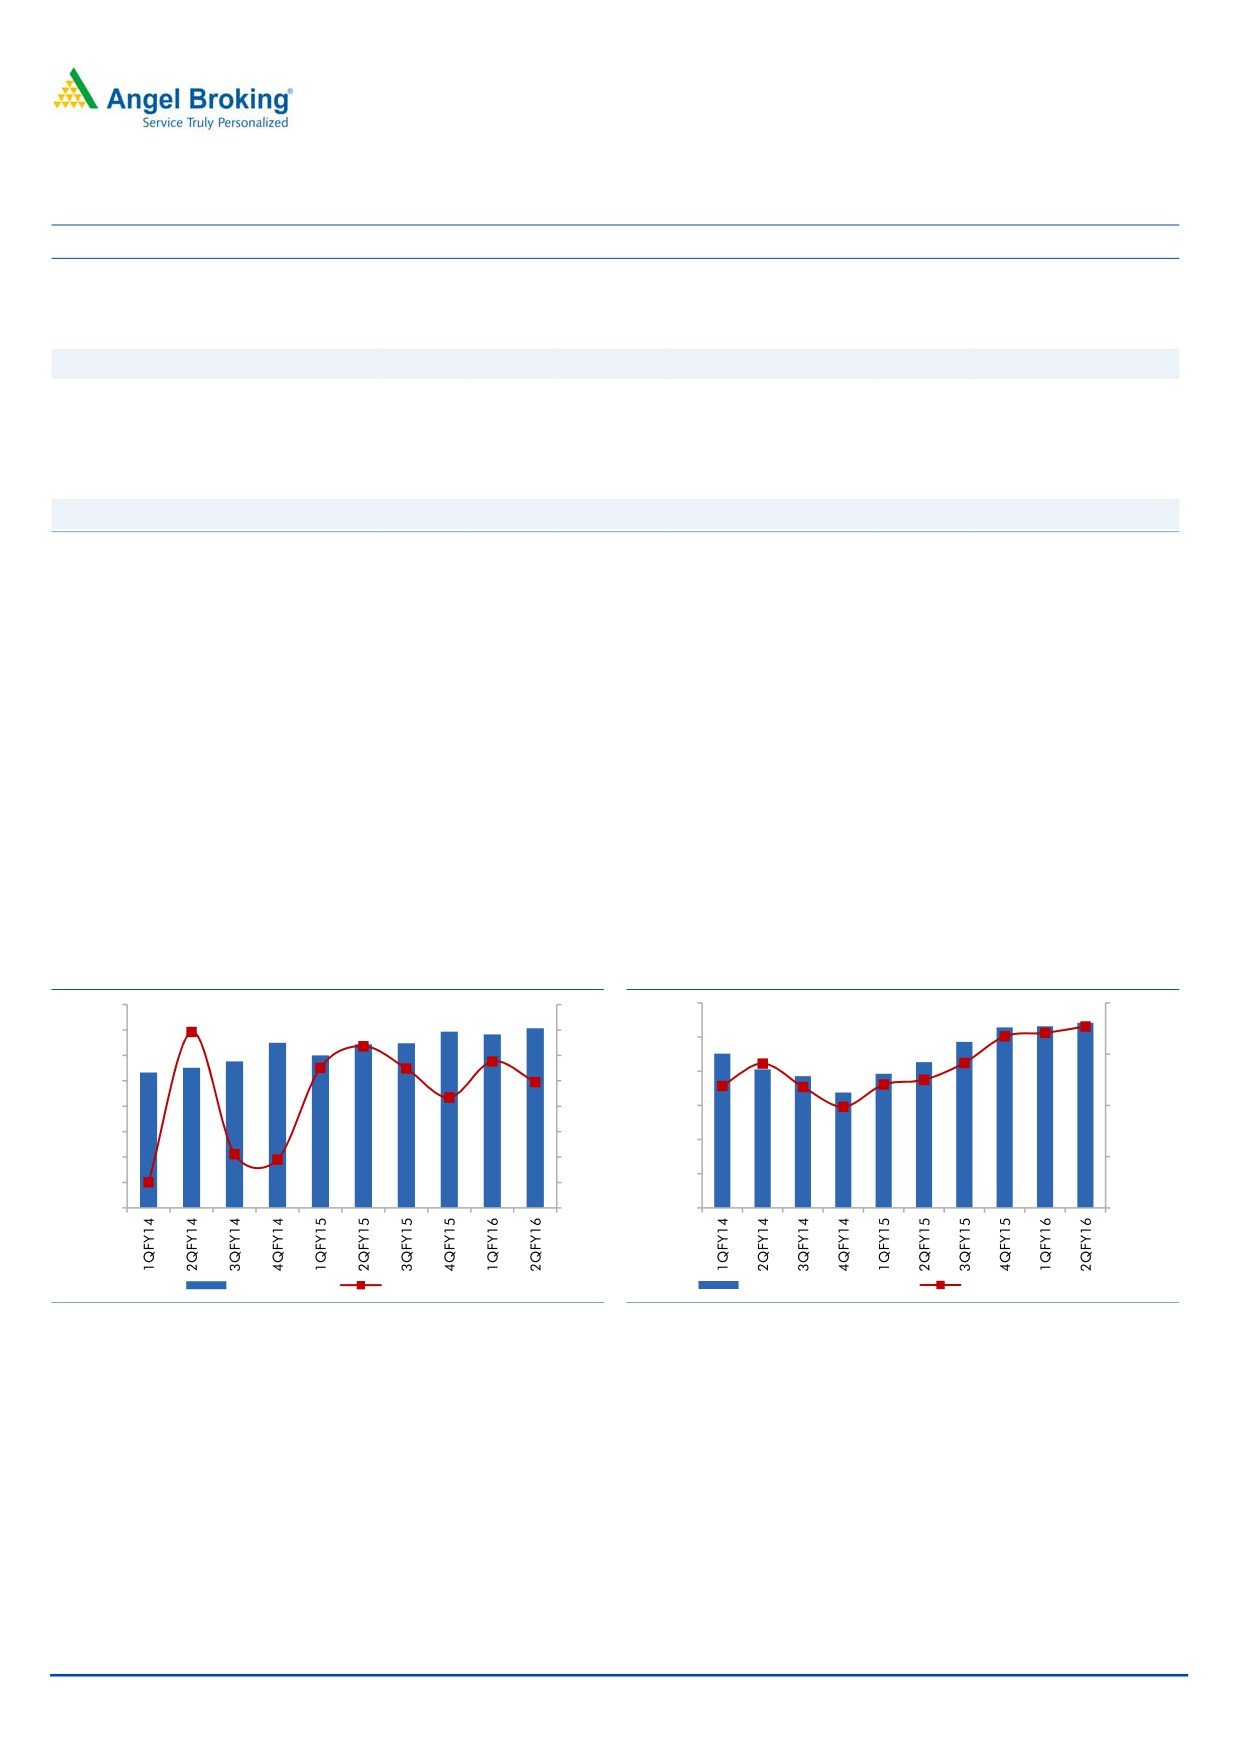
MSIL maintained its outperformance during the quarter, reporting a double-
digit volume growth. Improved consumer sentiments, better economic outlook,
and declining fuel prices boosted sales.
Realisation/vehicle grew 3% yoy owing to a better product mix with higher
volumes of Ciaz and Celerio. Further, the Contribution/vehicle improved
sharply by 19% due to currency benefits (weak Japanese Yen and Euro against
the INR), soft commodity prices, and a better product mix.
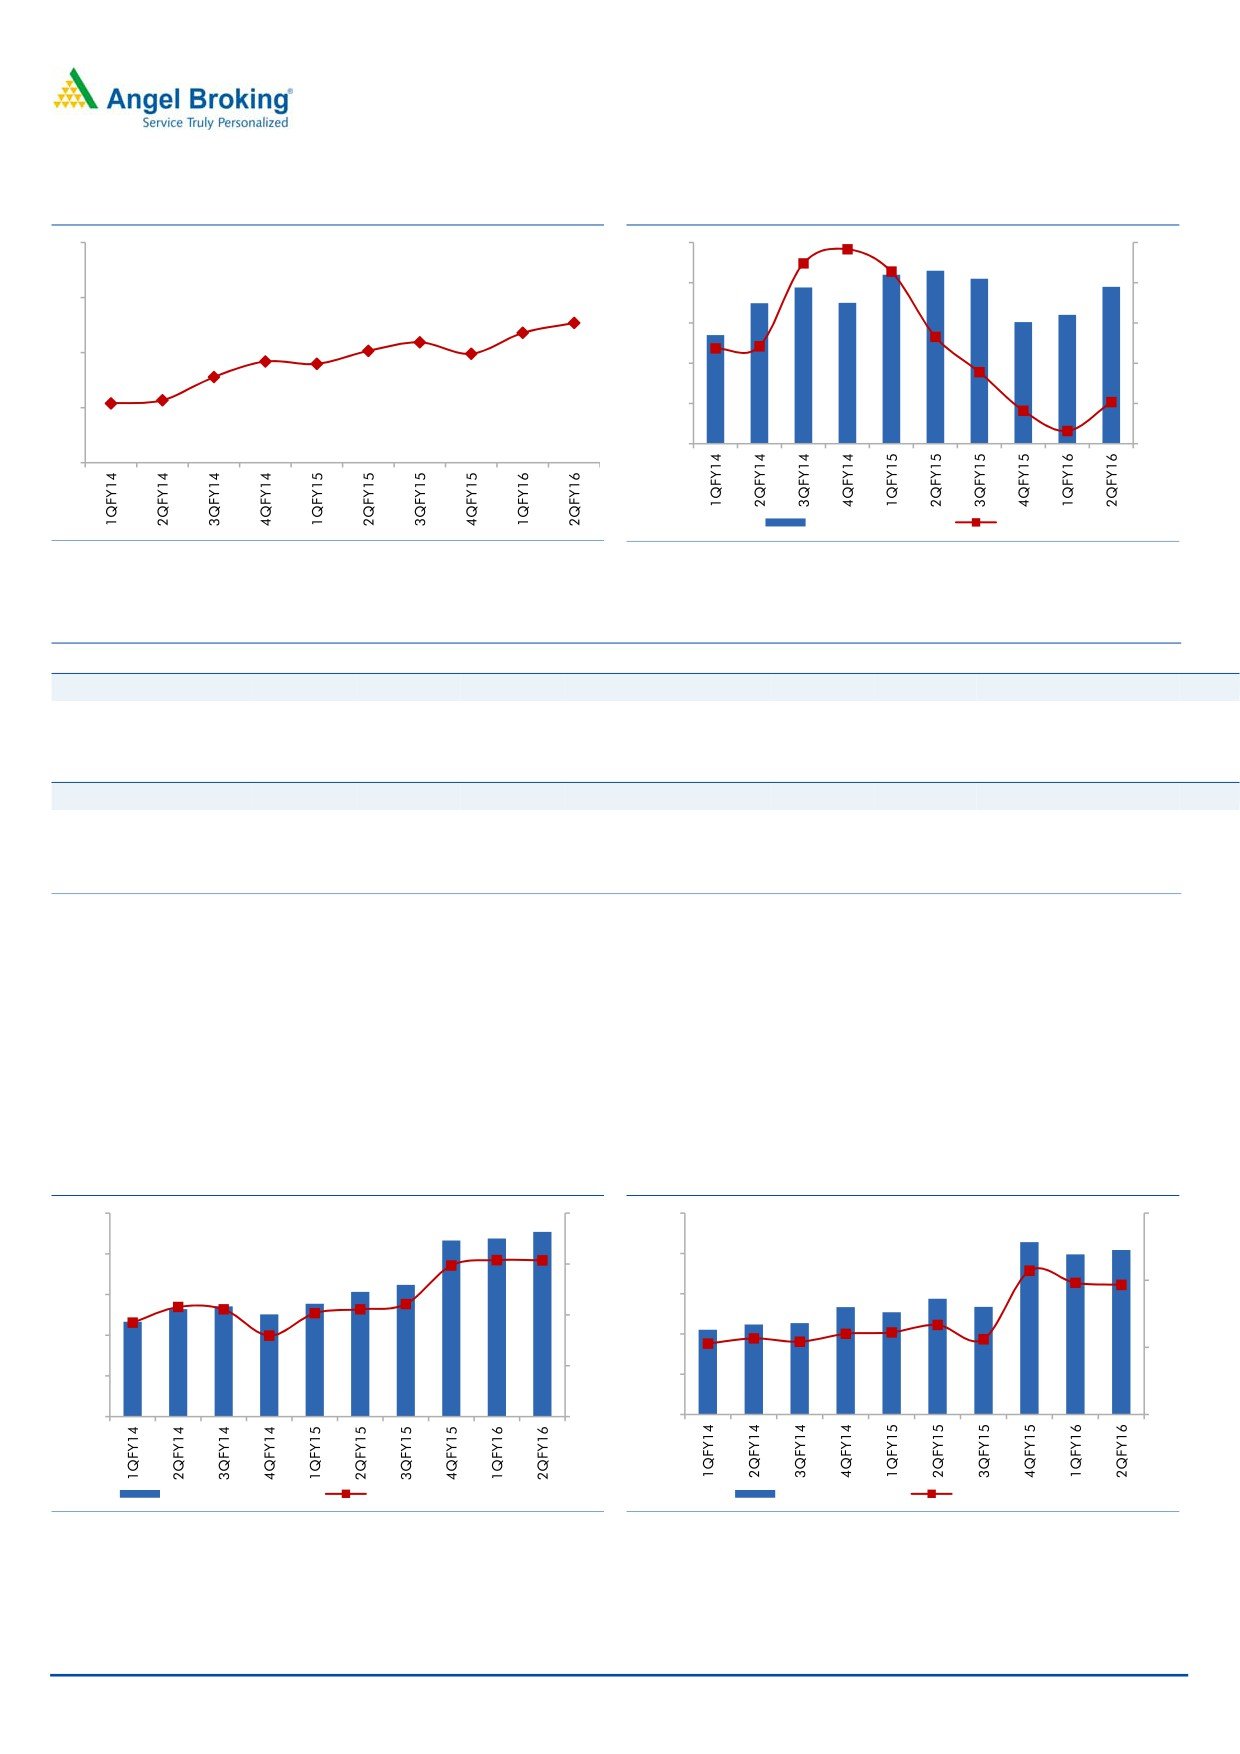
MSIL continued to outperform the domestic passenger vehicle industry,
registering a growth of 12% yoy in 1HFY2016 as compared to industry growth
of 6% yoy. Consequently, MSIL’s market share improved from 44.6% in
1HFY2015 to 47.3% in 1HFY2016.
Exhibit 4: Volumes grow in double-digits
Exhibit 5: Realisation & contribution per vehicle
400,000
25
390,000
140,000
350,000
20
380,000
300,000
15
120,000
370,000
250,000
10
200,000
5
360,000
100,000
150,000
0
350,000
100,000
(5)
80,000
340,000
50,000
(10)
0
(15)
330,000
60,000
Volumes (units)
growth yoy (%)
Realisation/vehicle (LHS)
Contribution/vehicle (RHS)
Source: Company, Angel Research
Source: Company, Angel Research
October 28, 2015
3
Maruti Suzuki | 2QFY2016 Result Update
Exhibit 6: Domestic PV market share trend
Exhibit 7: Discounting continues to soften
55
25,000
70
20,000
50
50
47.7
46.8
45.9
15,000
30
45.2
44.9
44.2
44.0
45
42.8
10,000
10
40.4
40.7
40
5,000
(10)
0
(30)
35
Discounting/vehicle
Growth (%)
Source: SIAM, Angel Research
Source: Company, Angel Research
Exhibit 8: Quarterly revenue and realization performance
2QFY2014 3QFY2014 4QFY2014 1QFY2015 2QFY2015 3QFY2015 4QFY2015 1QFY2016 2QFY2016
Domestic revenue (` cr)
8,693
9,691
10,696
9,831
10,595
11,039
12,070
11,694
12,447
Change yoy (%)
31.5
0.6
(7.2)
8.2
21.9
13.9
12.8
19.0
17.5
Domestic realization (`)
359,859
361,343
358,214
363,228
368,294
373,952
380,539
382,550
385,029
Change yoy (%)
14.3
0.8
(4.0)
(1.9)
2.3
3.5
6.2
5.3
4.5
Export revenue (` cr)
1,519
929
1,122
1,243
1,401
1,224
1,203
1,384
1,128
Change yoy (%)
84.3
(29.6)
(26.7)
37.0
(7.8)
31.8
7.2
11.3
(19.5)
Export realization (`)
446,450
465,291
427,038
424,943
409,517
426,347
407,217
388,382
375,175
Change yoy (%)
10.6
14.5
(2.8)
(1.2)
(8.3)
(8.4)
(4.6)
(8.6)
(8.4)
Source: Company, Angel Research
MSIL maintained record high operating margins of
16.3%, similar to
1QFY2016. Margins improved sharply by 390bp yoy. Currency benefits (JPY
and Euro depreciation against the INR) leading to lower raw material import
costs, coupled with lower discounts boosted margins.
The strong operating performance boosted profitability. The net profit grew by
a robust 42% yoy to `1,226cr, and the same is in line with our estimate.
Exhibit 9: Maintains record EBITDA margin
Exhibit 10: Strong operating performance boosts PAT
2,500
20
1,500
12
1,200
2,000
16
9
1,500
900
12
1,000
600
6
8
500
300
0
4
0
3
EBIDTA (`cr; LHS)
EBIDTA Margin (%; RHS)
PAT (`cr; LHS)
PAT Margin (%; RHS)
Source: Company, Angel Research
Source: Company, Angel Research
October 28, 2015
4
Maruti Suzuki | 2QFY2016 Result Update
Conference call - Key highlights
The share of petrol vehicles in the passenger vehicle industry continues to rise
given the narrowing differential between the price of petrol and diesel. The
share of petrol vehicles in the industry volumes rose to 54% in 2QFY2016 as
compared to 50% in 2QFY2015.
MSIL has been consistently outperforming the passenger vehicle industry on
back of new launches. In 1HFY2016, MSIL’s volumes grew 12% as compared
to the industry growth of 6%. Consequently, MSIL’s market share has risen
from 44.6% in 1HFY2015 to 47.3% in 1HFY2016. To further cement its
leadership position, MSIL recently introduced the premium hatchback
-
Baleno, which would be exclusively sold through “Nexa” showrooms.
MSIL continues to expand reach in rural areas. Despite weak sentiments in
rural areas on account of deficient rainfall and moderate growth in MSPs,
MSIL managed to report a 10% yoy growth in rural volumes in 2QFY2016.
The rural segment currently contributes by about one-third to the company’s
overall volumes.
MSIL is on track towards establishing its premium “Nexa” showroom network.
It currently has 80 Nexa showrooms and plans to increase them to 100 by the
end of FY2016. MSIL plans to further increase the Nexa count to 200 by
FY2017. Apart from the S-Cross, the recently introduced hatchback Baleno
would also be sold exclusively through the “Nexa” channel.
As per the company, certain export markets in Africa and Latin America are
facing a slowdown on account of slump in oil and commodity prices. Export
sales are likely to remain sluggish in the near term.
MSIL’s capacity utilization currently is at about 90% levels. As per the
company, the current production capacity of 1.5mn units is sufficient to meet
demand for FY2016; but the same would be enhanced to cater to the
anticipated increase in demand in FY2017. MSIL is in the process of
debottlenecking the existing plants in order to increase capacity as the new
Gujarat plant is expected to come on-stream only in FY2018.
MSIL has guided for a capex of `3,500cr for FY2016, to be incurred towards
new product introductions, enhancing the marketing infrastructure (particularly
Nexa showrooms), research and development, and maintenance.
MSIL indicated that the current dealer inventory stands at about 1 month,
which is the normal trend.
October 28, 2015
5
Maruti Suzuki | 2QFY2016 Result Update
Investment arguments
Per capita car penetration near inflexion point: In FY2012, passenger vehicle
penetration in India was estimated at around 16 vehicles/1,000 people
compared to around 70 vehicles/1,000 people in China. Moreover, India’s
PPP-based per capita is estimated to approach US$7,000 over the next four to
five years, which is expected to be the inflexion point for the country’s car
demand. Further, MSIL has a sizeable competitive advantage over new foreign
entrants due to its widespread distribution network (nearly 3,000 and 1,200
service and sales outlets, respectively), which is not easy to replicate.
Product launches in new segments to help outpace the PV industry: MSIL is
targeting to launch products in new segments in order to outgrow the
passenger vehicle industry. MSIL would introduce products in the compact
utility vehicle space which currently accounts for about 10% of the industry
volumes. Also, MSIL would introduce crossovers (vehicles combining features
of a car and a SUV) which would further enable it to gain market share.
Merger with SPIL to be a positive in the long run: MSIL has merged its
associate company, Suzuki Powertrain India (SPIL) with itself. SPIL
manufactures and supplies diesel engines and transmission components for
vehicles. SPIL currently supplies ~90% of its production to MSIL. We believe
the merger of SPIL with MSIL is a positive for MSIL given that MSIL itself is
setting up a new diesel engine facility (capacity of 300,000 units by FY2015)
in Gurgaon. Further, with increased product introductions in the diesel
segment (LCV and compact utility vehicle), the integration of SPIL will result in
better control over diesel engine sourcing, flexibility in production planning,
and managing fluctuations in market demand. Additionally, single
management control of diesel engine operations will result in better sourcing,
localization, and cost-reduction.
October 28, 2015
6
Maruti Suzuki | 2QFY2016 Result Update
Outlook and valuation
The passenger vehicle (PV) industry is well poised to post double-digit growth over
the next two years, given the improved consumer sentiments, better economic
outlook, and softer fuel prices. Further, new launches by MSIL, with it having
recently introduced the premium hatch - Baleno and a new compact SUV, would
enable it to gain market share, going ahead. Also, we believe MSIL would be able
to sustain higher margins (we have built in ~17% margin levels in our estimates
for FY2016/17) given the subdued commodity prices and favorable currency rates.
Reduction in discounts due to improved industry outlook coupled with new product
launches and benefits of operating leverage would also enable MSIL to sustain
margins at elevated levels. We view MSIL as the best play on passenger vehicle
demand recovery and expect 36% earnings CAGR over FY2015-2017. We have
retained our earnings estimates given the inline results and maintain our
Accumulate rating on the stock with a price target of `4,960 (based on a PE
multiple of 22x FY2017 EPS).
Exhibit 11: Volume assumptions
Y/E March
FY2011
FY2012
FY2013
FY2014
FY2015
FY2016E
FY2017E
Mini: M800, Alto, WagonR
573,238
491,389
429,569
436,032
425,742
458,099
495,599
Compact: Swift, Ritz, Celerio, Dzire
369,754
345,886
424,873
450,393
514,638
571,248
651,223
Compact Utility Vehicle
12,000
36,000
Mid-Size: Ciaz
23,317
17,997
6,707
4,029
33,151
48,000
60,600
Executive: Kizashi
138
458
188
1
-
Total passenger cars
966,447
855,730
861,337
890,455
973,531
1,089,347
1,243,422
UV - Gypsy, Vitara, Ertiga, S-Cross
5,666
6,525
79,192
61,119
68,198
77,746
85,520
Vans - Omni, Versa, Eeco
160,626
144,061
110,517
102,115
128,973
141,870
156,057
Total passenger vehicles - domestic
1,132,739
1,006,316
1,051,046
1,053,689
1,170,702
1,308,963
1,485,000
Total passenger vehicles - exports
138,266
127,379
120,388
101,352
121,713
133,701
146,000
Light Commercial Vehicle
9,000
21,000
Total sales (domestic + exports)
1,271,005
1,133,695
1,171,434
1,155,041
1,292,415
1,451,664
1,652,000
% chg
24.8
(10.8)
3.3
(1.4)
11.9
12.3
13.8
Source: Company, Angel Research
Company background
Maruti Suzuki (MSIL), a subsidiary of Suzuki Motor Corporation (SMC), Japan
(which holds a 56% stake in MSIL), is the largest passenger car company in India,
accounting for ~50% of the domestic passenger car market. MSIL derives ~60%
of its overall sales from the small car segment and has a dominant position in the
segment with a market share of ~50%, led by popular models like Alto, Wagon R,
Celerio and Swift. The company operates from two facilities in India (Gurgaon and
Manesar) with an installed capacity of 1.5mn units. Also, MSIL has steadily
increased its presence internationally and exports now account for ~10% of its
overall sales volume.
October 28, 2015
7
Maruti Suzuki | 2QFY2016 Result Update
Profit and loss statement (post SPIL merger)
Y/E March (` cr)
FY2012
FY2013
FY2014
FY2015
FY2016E
FY2017E
Total operating income
35,587
43,588
43,701
49,971
57,865
68,104
% chg
(2.8)
22.5
1.4
14.3
15.8
17.7
Total expenditure
33,074
39,358
38,611
43,268
48,381
56,698
Net raw material costs
28,108
32,559
31,314
35,008
38,764
45,571
Employee expenses
844
1,070
1,368
1,607
1,790
2,024
Other expenditure
4,122
5,730
5,928
6,654
7,826
9,103
EBITDA
2,513
4,230
5,090
6,703
9,484
11,406
% chg
(30.9)
68.3
44.8
31.5
41.5
20.3
(% of total op. income)
7.1
9.7
11.6
13.4
16.4
16.7
Depreciation & amortization
1,138
1,861
2,084
2,470
2,716
2,980
EBIT
1,375
2,368
3,834
5,074
7,497
9,449
% chg
(47.6)
72.3
27.7
32.3
47.7
26.0
(% of total op. income)
3.9
5.4
8.8
10.2
13.0
13.9
Interest and other charges
55
190
176
206
127
120
Other income
827
812
829
842
729
1023
Recurring PBT
2,146
2,991
3,659
4,868
7,370
9,329
% chg
(31.0)
39.4
27.7
33.1
51.4
26.6
Extraordinary income/ (exp.)
-
-
-
PBT
2,146
2,991
3,659
4868.2
7370.3
9329.4
Tax
511
599
876
1,157
2,046
2,519
(% of PBT)
23.8
20.0
23.9
23.8
27.8
27.0
PAT (reported)
1,635
2,392
2,783
3,711
5,324
6,810
ADJ. PAT
1,635
2,392
2,783
3,711
5,324
6,810
% chg
(28.6)
46.3
21.0
33.4
43.5
27.9
(% of total op. income)
4.6
5.5
6.4
7.4
9.2
10.0
Basic EPS (`)
54.1
79.2
92.1
122.9
176.3
225.5
Adj. EPS (`)
54.1
79.2
92.1
122.9
176.3
225.5
% chg
(28.6)
46.3
15.8
33.4
43.5
27.9
October 28, 2015
8
Maruti Suzuki | 2QFY2016 Result Update
Balance sheet statement (post SPIL merger)
Y/E March (` cr)
FY2012 FY2013 FY2014 FY2015 FY2016E FY2017E
SOURCES OF FUNDS
Equity share capital
145
151
151
151
151
151
Reserves & surplus
15,043
18,428
20,827
23,553
27,280
32,047
Shareholders’ Funds
15,187
18,579
20,978
23,704
27,431
32,198
Total loans
1,078
1,389
1,685
180
200
200
Deferred tax liability
302
409
587
481
587
587
Other long term liabilities
97
104
239
105
105
105
Long term provisions
169
226
198
293
198
198
Total Liabilities
16,834
20,706
23,686
24,763
28,521
33,288
APPLICATION OF FUNDS
Gross block
14,735
19,801
22,702
26,462
29,962
33,712
Less: Acc. depreciation
7,214
10,002
11,911
14,202
16,918
19,898
Net Block
7,521
9,799
10,790
12,259
13,043
13,813
Capital work-in-progress
942
1,942
2,621
1,883
2,500
2,500
Investments
6,147
7,078
10,118
12,814
9,849
10,849
Long term loans and adv.
1,341
1,279
1,638
1,349
1,970
2,319
Other noncurrent assets
26
895
9
44
44
44
Current assets
6,325
5,695
5,359
5,202
8,998
12,775
Cash
2,436
775
630
18
3,472
6,354
Loans & advances
778
1,115
1,251
1,173
1,581
1,846
Other
3,111
3,805
3,478
4,010
3,945
4,575
Current liabilities
5,468
5,982
6,849
8,788
7,883
9,011
Net current assets
857
(287)
(1,491)
(3,586)
1,115
3,764
Total Assets
16,834
20,706
23,686
24,763
28,521
33,288
Note: Cash and bank balance includes term deposits with banks
October 28, 2015
9
Maruti Suzuki | 2QFY2016 Result Update
Cash flow statement (post SPIL merger)
Y/E March (` cr)
FY2012 FY2013 FY2014 FY2015 FY2016E FY2017E
Profit before tax
2,146
2,991
3,659
4,868
7,370
9,329
Depreciation
1,138
1,861
1,910
2,291
2,716
2,980
Change in working capital
227
512
2,112
1,440
(1,248)
233
Direct taxes paid
(251)
(533)
(876)
(1,157)
(2,046)
(2,519)
Others
(700)
(447)
(242)
154
(610)
(349)
Cash Flow from Operations
2,560
4,384
6,563
7,596
6,182
9,675
(Inc.)/Dec. in fixed assets
(2,963)
(3,810)
(3,580)
(3,021)
(4,117)
(3,750)
(Inc.)/Dec. in investments
(782)
(916)
(3,040)
(2,687)
2,966
(1,000)
Others
649
1,152
-
Cash Flow from Investing
(3,096)
(3,574)
(6,620)
(5,708)
(1,152)
(4,750)
Issue of equity
-
-
-
-
-
-
Inc./(Dec.) in loans
911
(514)
296
(1,505)
20
-
Dividend paid (Incl. Tax)
(217)
(217)
(696)
(884)
(1,597)
(2,043)
Others
(78)
(235)
312
(101)
-
-
Cash Flow from Financing
617
(966)
(88)
(2,388)
(1,577)
(2,043)
Inc./(Dec.) in cash
81
(156)
(145)
(501)
3,453
2,882
Opening Cash balances
96
281
775
630
18
3,472
Closing Cash balances
176
125
630
18
3,472
6,354
Note: Closing Cash balances excludes term deposits with banks and unclaimed dividend accounts
October 28, 2015
10
Maruti Suzuki | 2QFY2016 Result Update
Key ratios
Y/E March
FY2012
FY2013
FY2014
FY2015
FY2016E
FY2017E
Valuation Ratio (x)
P/E (on FDEPS)
83.1
56.5
48.8
36.6
25.5
19.9
P/CEPS
49.0
35.3
27.9
22.0
16.9
11.5
P/BV
8.9
7.0
6.5
5.7
5.0
3.4
Dividend yield (%)
0.2
0.2
0.3
0.6
1.2
1.5
EV/Sales
3.6
3.0
2.9
2.7
2.2
1.8
EV/EBITDA
48.4
37.3
25.1
19.8
13.1
10.6
EV / Total Assets
7.7
6.4
5.4
5.4
4.4
3.6
Per Share Data (`)
EPS (Basic)
54.1
79.6
92.1
122.9
176.3
225.5
EPS (fully diluted)
54.1
79.6
92.1
122.9
176.3
225.5
Cash EPS
91.8
127.5
161.1
204.6
266.2
324.1
DPS
7.5
8.4
12.0
25.0
52.9
67.6
Book Value
502.8
643.1
694.5
784.7
908.1
1065.9
Du-pont Analysis
EBIT margin
3.9
7.0
8.8
10.2
13.0
13.9
Tax retention ratio
76.2
0.8
0.8
0.8
0.7
0.7
Asset turnover (x)
2.7
2.2
1.9
2.0
2.3
2.5
ROIC (Post-tax)
7.9
12.2
12.7
15.6
21.6
25.6
Cost of Debt (Post Tax)
6.1
7.9
7.9
87.2
45.8
43.8
Leverage (x)
(0.5)
(0.3)
(0.4)
(0.5)
(0.5)
(0.5)
Operating ROE
7.0
10.7
10.6
53.8
33.2
35.2
Returns (%)
ROCE (Pre-tax)
8.8
14.7
16.2
20.5
26.3
28.4
Angel ROIC (Pre-tax)
18.3
15.2
16.6
20.5
29.9
35.1
ROE
11.3
12.4
13.3
15.7
19.4
21.2
Turnover ratios (x)
Asset Turnover (Gross Block)
2.7
2.2
1.9
1.9
1.9
2.0
Inventory / Sales (days)
16
16
14
19
13
12
Receivables (days)
9
12
12
8
11
11
Payables (days)
37
45
52
54
45
43
WC cycle (ex-cash) (days)
(12)
(18)
(26)
(27)
(21)
(20)
Solvency ratios (x)
Net debt to equity
(0.5)
(0.3)
(0.4)
(0.5)
(0.5)
(0.5)
Net debt to EBITDA
(3.0)
(1.8)
(1.8)
(1.9)
(1.4)
(1.5)
Interest Coverage (EBIT / Int.)
24.9
22.0
21.8
24.6
59.1
78.7
October 28, 2015
11
Maruti Suzuki | 2QFY2016 Result Update
Research Team Tel: 022 - 39357800
DISCLAIMER
Angel Broking Private Limited (hereinafter referred to as “Angel”) is a registered Member of National Stock Exchange of India Limited,
Bombay Stock Exchange Limited and Metropolitan Stock Exchange of India Limited. It is also registered as a Depository Participant with
CDSL and Portfolio Manager with SEBI. It also has registration with AMFI as a Mutual Fund Distributor. Angel Broking Private Limited is
a registered entity with SEBI for Research Analyst in terms of SEBI (Research Analyst) Regulations, 2014 vide registration number
INH000000164. Angel or its associates has not been debarred/ suspended by SEBI or any other regulatory authority for accessing
/dealing in securities Market. Angel or its associates including its relatives/analyst do not hold any financial interest/beneficial
ownership of more than 1% in the company covered by Analyst. Angel or its associates/analyst has not received any compensation /
managed or co-managed public offering of securities of the company covered by Analyst during the past twelve months. Angel/analyst
has not served as an officer, director or employee of company covered by Analyst and has not been engaged in market making activity
of the company covered by Analyst.
This document is solely for the personal information of the recipient, and must not be singularly used as the basis of any investment
decision. Nothing in this document should be construed as investment or financial advice. Each recipient of this document should
make such investigations as they deem necessary to arrive at an independent evaluation of an investment in the securities of the
companies referred to in this document (including the merits and risks involved), and should consult their own advisors to determine
the merits and risks of such an investment.
Reports based on technical and derivative analysis center on studying charts of a stock's price movement, outstanding positions and
trading volume, as opposed to focusing on a company's fundamentals and, as such, may not match with a report on a company's
fundamentals.
The information in this document has been printed on the basis of publicly available information, internal data and other reliable
sources believed to be true, but we do not represent that it is accurate or complete and it should not be relied on as such, as this
document is for general guidance only. Angel Broking Pvt. Limited or any of its affiliates/ group companies shall not be in any way
responsible for any loss or damage that may arise to any person from any inadvertent error in the information contained in this report.
Angel Broking Pvt. Limited has not independently verified all the information contained within this document. Accordingly, we cannot
testify, nor make any representation or warranty, express or implied, to the accuracy, contents or data contained within this document.
While Angel Broking Pvt. Limited endeavors to update on a reasonable basis the information discussed in this material, there may be
regulatory, compliance, or other reasons that prevent us from doing so.
This document is being supplied to you solely for your information, and its contents, information or data may not be reproduced,
redistributed or passed on, directly or indirectly.
Neither Angel Broking Pvt. Limited, nor its directors, employees or affiliates shall be liable for any loss or damage that may arise from
or in connection with the use of this information.
Note: Please refer to the important ‘Stock Holding Disclosure' report on the Angel website (Research Section). Also, please refer to the
latest update on respective stocks for the disclosure status in respect of those stocks. Angel Broking Pvt. Limited and its affiliates may
have investment positions in the stocks recommended in this report.
Disclosure of Interest Statement
Maruti Suzuki
1. Analyst ownership of the stock
No
2. Angel and its Group companies ownership of the stock
No
3. Angel and its Group companies' Directors ownership of the stock
No
4. Broking relationship with company covered
No
Note: We have not considered any Exposure below ` 1 lakh for Angel, its Group companies and Directors
Ratings (Based on expected returns
Buy (> 15%)
Accumulate (5% to 15%)
Neutral (-5 to 5%)
over 12 months investment period):
Reduce (-5% to -15%)
Sell (< -15)
October 28, 2015
12